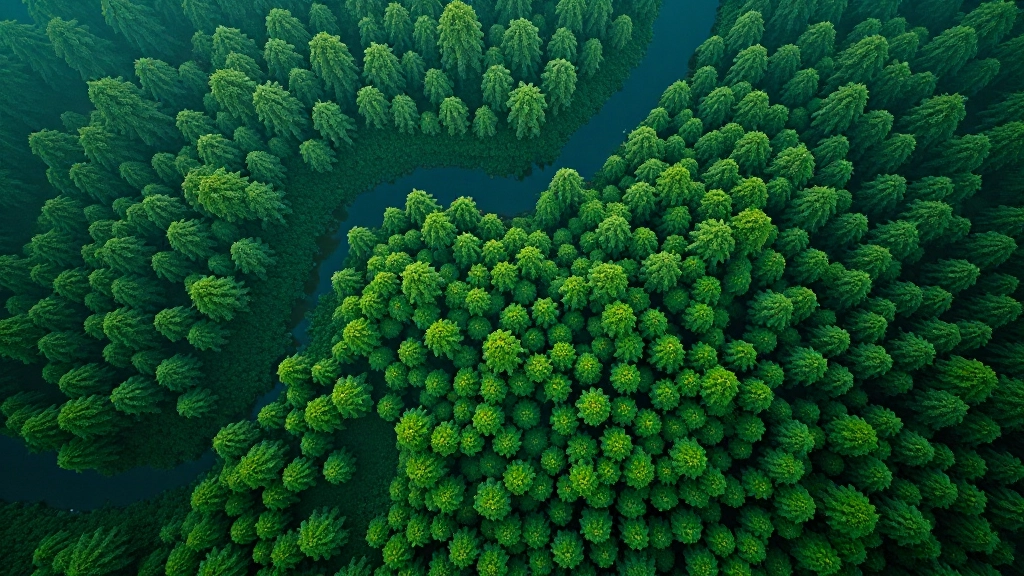
Monitoring Forest Health with Satellite Time-Series Data
Track forest canopy changes month-to-month using freely available satellite imagery. Learn how time-series analysis reveals pest pressure and recovery patterns.
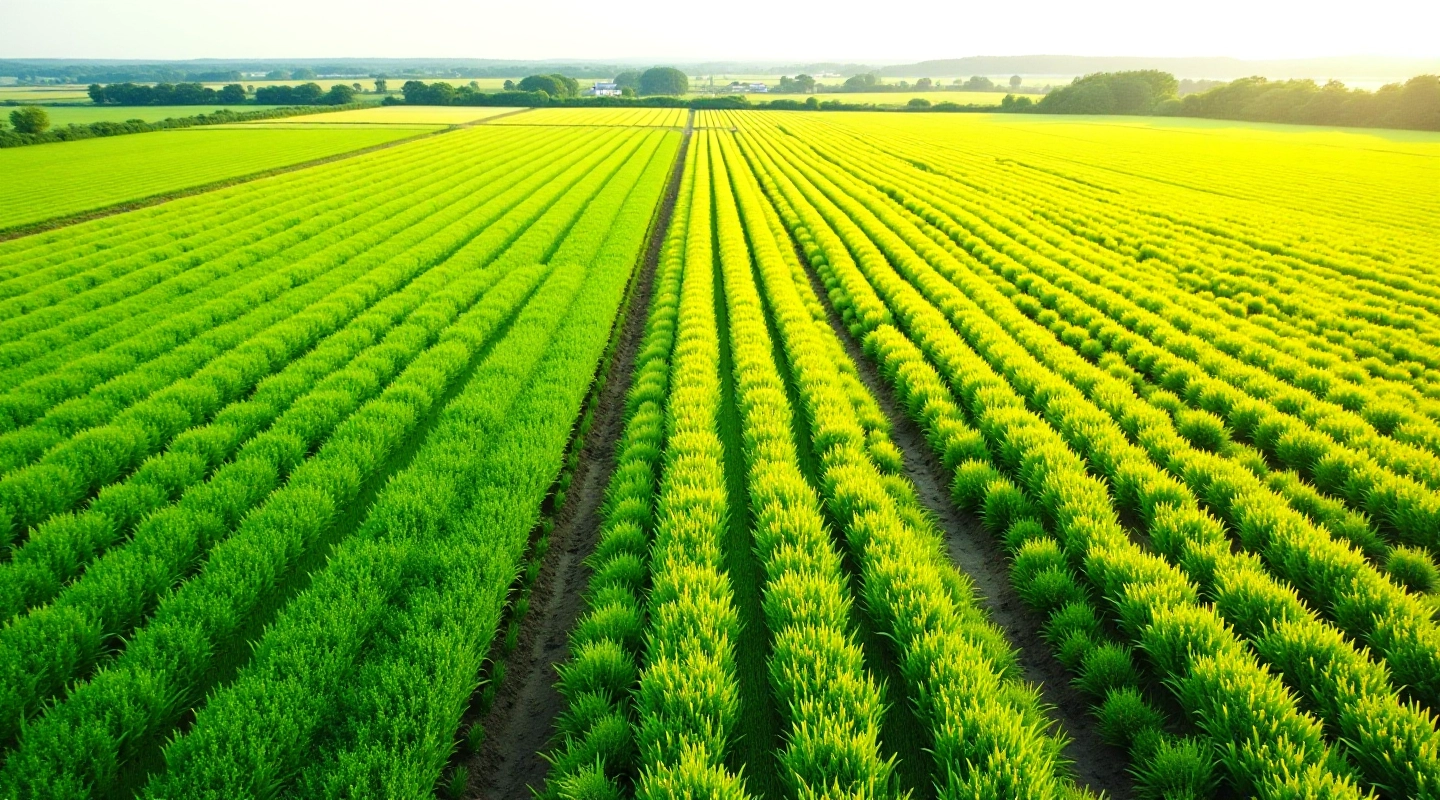
Plant stress doesn't announce itself. By the time you see yellowing leaves or wilting stems, you've already lost precious time and yield. That's where multispectral imaging changes everything — it catches problems weeks before they're visible to the naked eye.
Multispectral cameras capture data across multiple wavelengths of light, including invisible infrared bands that plants reflect in specific ways. When a crop's under stress — water shortage, nutrient deficiency, disease pressure — that reflection pattern shifts measurably. You're not guessing. You're reading the plant's actual physiology.
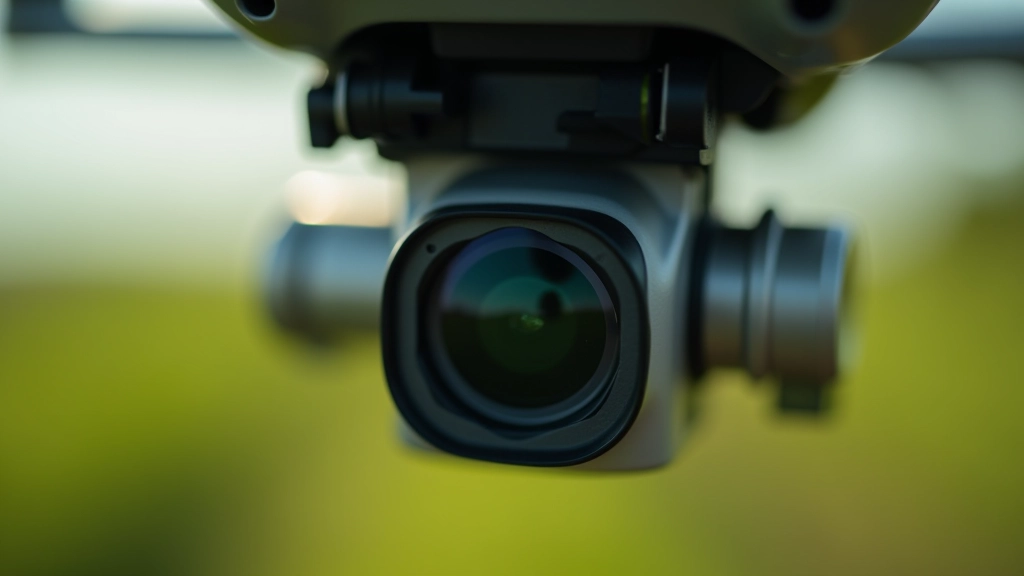
The most common metric you'll encounter is NDVI — the Normalized Difference Vegetation Index. It's not complicated once you see the math. You're comparing the near-infrared light (NIR) that plants reflect heavily with the red light they absorb for photosynthesis.
NDVI = (NIR - Red) / (NIR + Red)
The result ranges from -1 to +1. Healthy vegetation typically scores 0.5 to 0.9. Water and bare soil? Much lower. A field map colored by NDVI values shows you exactly which patches are struggling. Most multispectral drones calculate this automatically — you fly, the camera records the bands, software does the math, you get a heatmap.
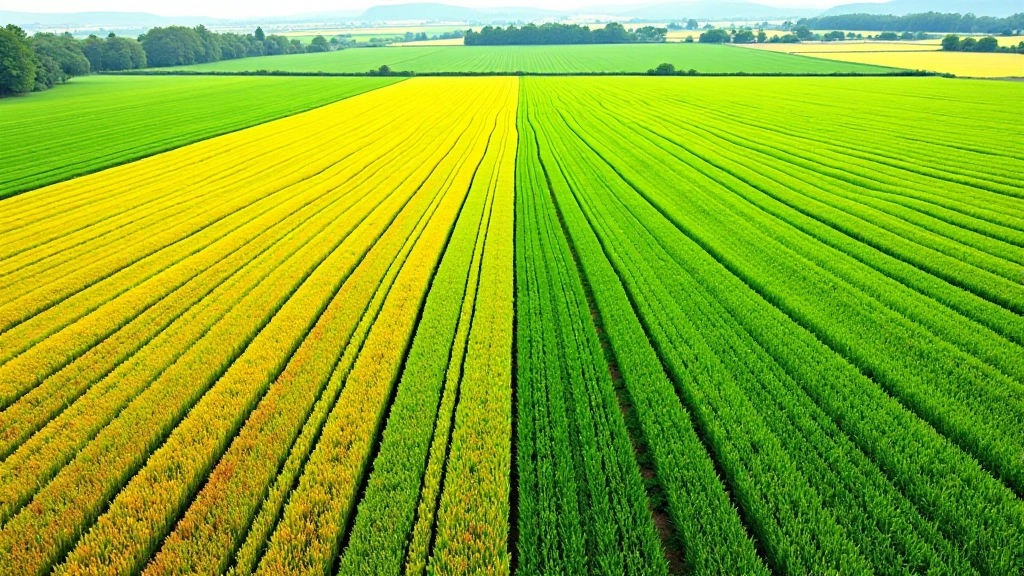
But here's what matters in practice: NDVI responds to stress about 1-3 weeks before visual symptoms appear. That's your early warning window. Catch it then, adjust irrigation or nutrients, and you're back on track.
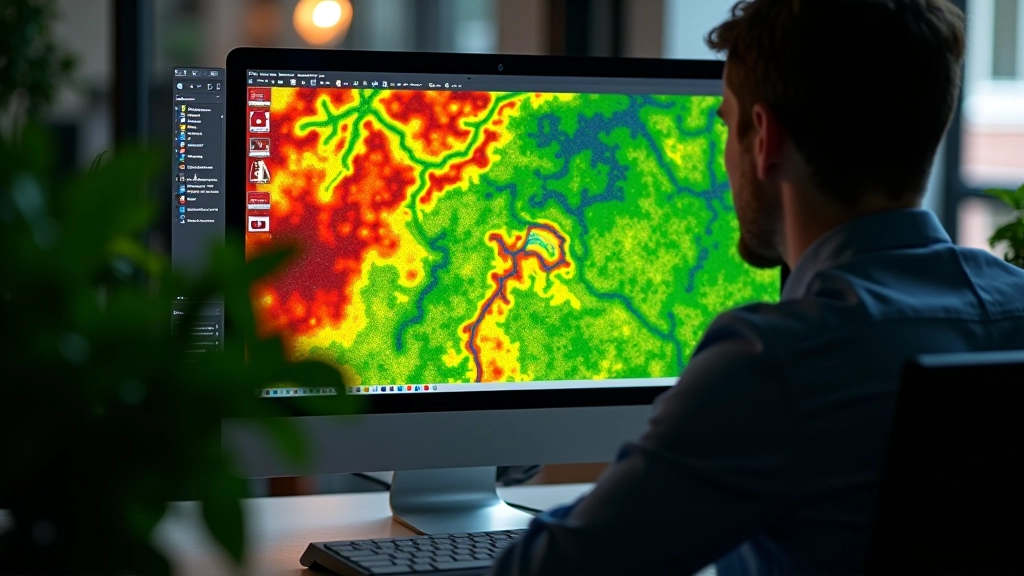
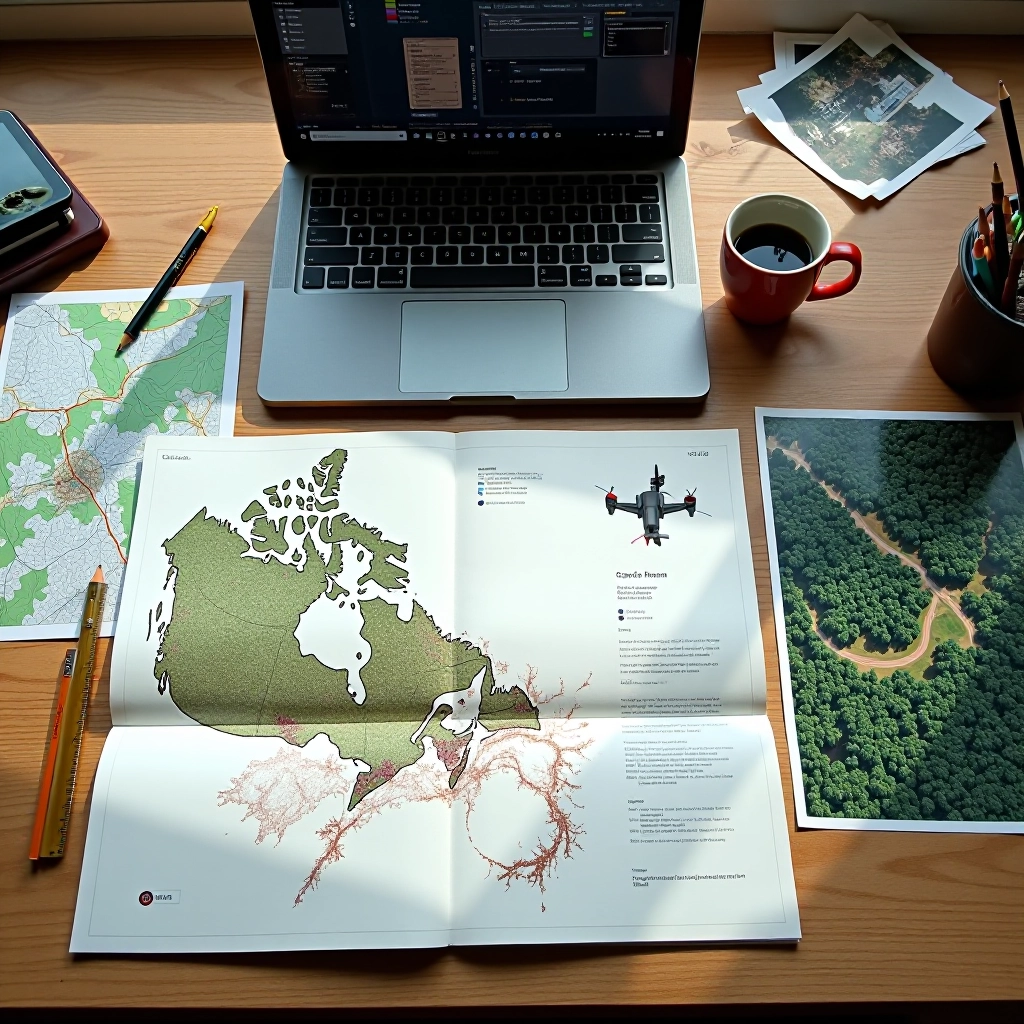
Raw sensor data isn't useful until you process it. You're collecting thousands of individual pixels, each with spectral values across 4-5 bands. The workflow looks like this: fly your field, download the raw imagery, georeference it to real-world coordinates, calculate vegetation indices, then overlay zones on your actual field geometry.
Most workflows use open-source tools like QGIS or specialized software like Pix4Dmapper. You're looking for zones where NDVI drops below your field's baseline — those are your stress hotspots. Don't just look at the map. Walk those zones. Check soil moisture, look for disease signs, examine leaf color in person. The technology flags the problem. You verify what's causing it.
Real-world example: a wheat field in late spring shows NDVI dips in a 2-hectare section. Looks like low vigor. Field walk reveals compacted soil from heavy equipment in fall. Immediate action — aeration or delayed nutrient application. Without the NDVI map, you'd have spotted it visually about three weeks later, if at all.
The key insight: NDVI is one data source. Combine it with field history, soil maps, weather data, and on-ground observation. A low NDVI zone in a field with poor drainage looks different from one in a field with recent herbicide application. Context matters enormously.
Timing also matters. Early season NDVI values are naturally lower — crops haven't reached full canopy yet. Mid-season comparisons are usually most informative. Late-season stress often reflects maturity patterns more than actionable problems. Fly consistently at similar growth stages across years to build useful baseline data.
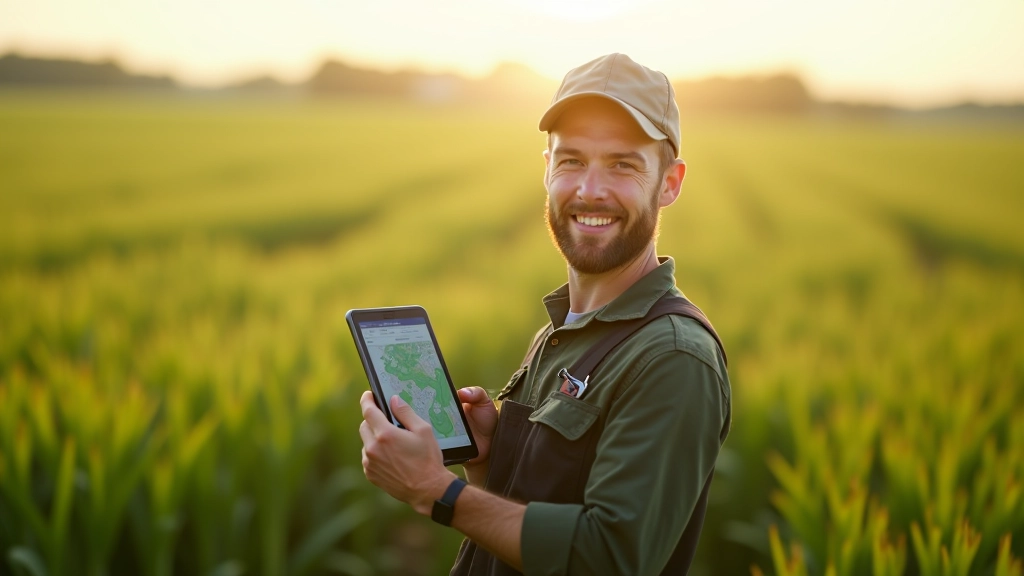
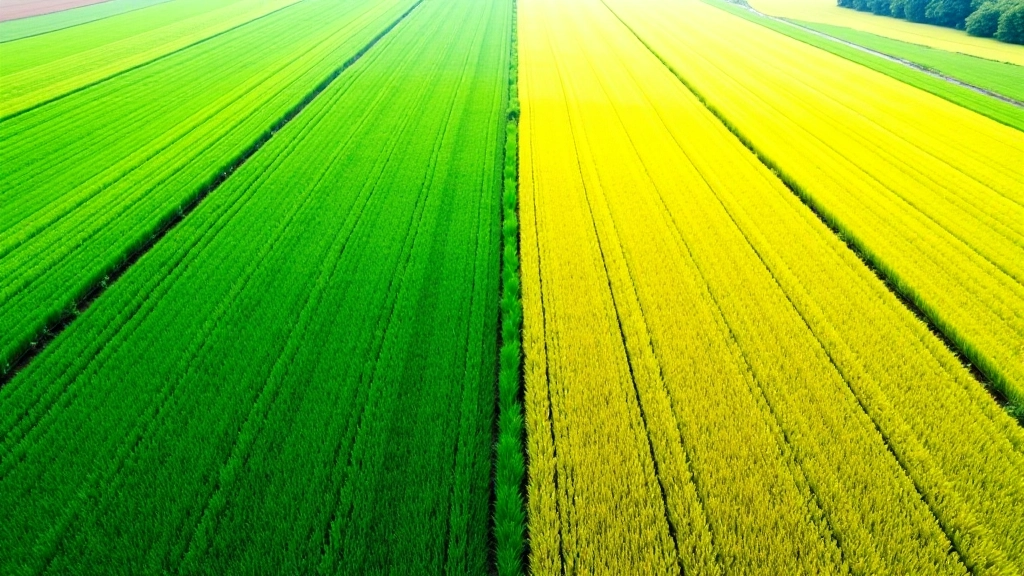
The ROI math is straightforward. Detecting water stress three weeks early means you can adjust irrigation before yield loss compounds. Catching disease pressure early means you can scout more carefully and spray targeted areas rather than the whole field. Identifying compaction issues mid-season gives you options for fall remediation instead of accepting the loss.
A 5-10% yield improvement in problem zones — which is realistic with early intervention — typically covers the cost of multispectral flights several times over in a season. That's why more operations are adopting this as standard practice, not optional add-on.
The technology doesn't make decisions for you. It gives you information faster. What you do with that information determines whether it pays off. That's the honest version: multispectral imagery is powerful because it extends your ability to notice what's happening. The rest is good farming.
This article provides educational information about multispectral imaging for crop monitoring. It's not a substitute for professional agronomic advice, pest management guidance, or field-specific consultation. NDVI and other vegetation indices are tools that complement — not replace — visual field scouting, soil testing, and professional agronomic judgment. Specific management decisions should be made in consultation with local agricultural extension services, agronomists, or crop consultants familiar with your local conditions, soil type, and crop variety. Environmental and crop responses vary significantly by region and year.
You don't need to become a remote sensing specialist to benefit from multispectral imagery. Start simple: fly your problem fields once or twice a season, compare NDVI maps to field performance, and notice patterns. That baseline knowledge builds fast. Within a couple of seasons, you'll see which zones consistently underperform, where your management practices need adjustment, and where your biggest yield levers actually are.
The technology's become accessible enough that it's worth trying. Whether you're flying a commercial drone yourself or working with a service provider, the information advantage is real. Plant stress happens early. Seeing it early changes everything.
Track forest canopy changes month-to-month using freely available satellite imagery. Learn how time-series analysis reveals pest pressure and recovery patterns.
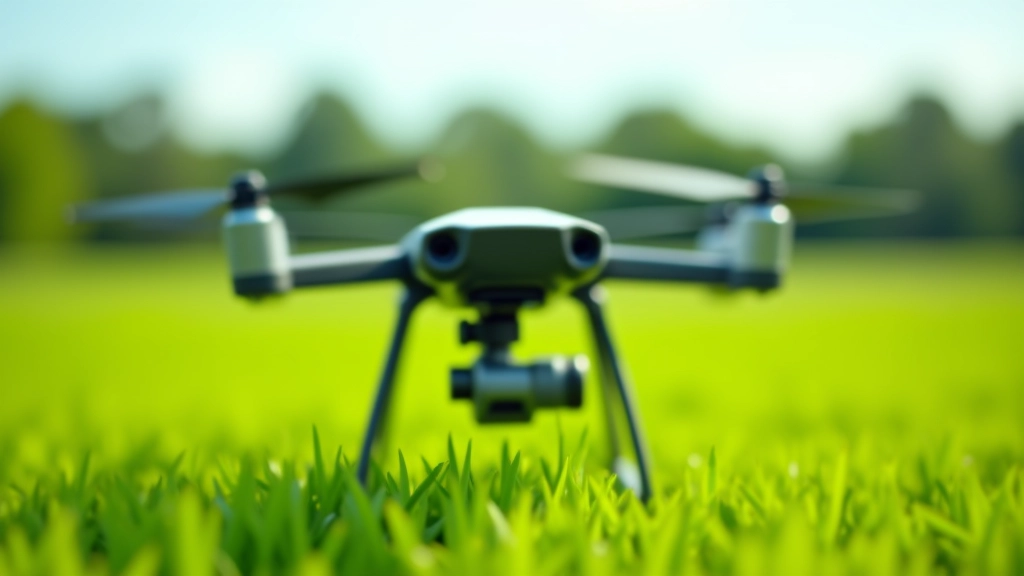
RGB cameras versus multispectral versus thermal — what you actually need depends on your specific monitoring goals and budget constraints.
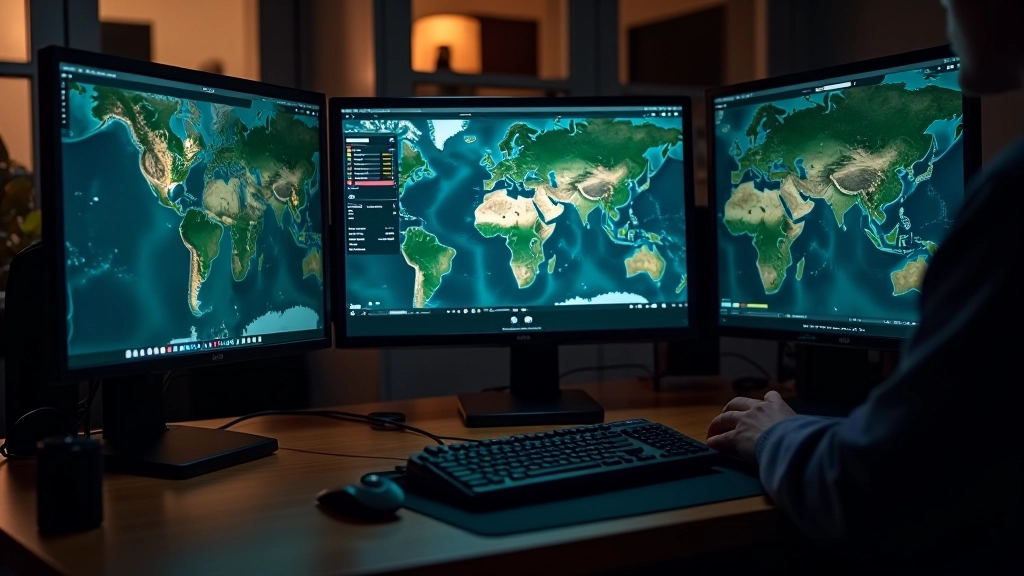
Raw satellite imagery isn't useful until you process it. Learn the workflow for turning raw data into field-ready management maps.